Creating a JMeter Test
— software development, coding, jmeter, testing, getting started — 7 min read

JMeter is a performance testing application written in Java. It's very straightforward to use and can provide lots of useful information about the application being tested. JMeter can simulate thousands of users, limited only by the hardware it is run on.
For more information on performance testing, check out my blog post about it!
Opening JMeter
The first step is to open JMeter.
Ok, you're right, the first step is to install JMeter, which you can do from here. You'll also need to have Java installed.
Once you've done that, you can open JMeter. In Windows, you'll go to wherever you installed JMeter on your computer, open the JMeter folder, open the bin folder, and find and open the jmeter.bat file. (If you're using a Mac, you'll need to navigate to and open the jmeter.sh file. Otherwise there is no difference from Windows)
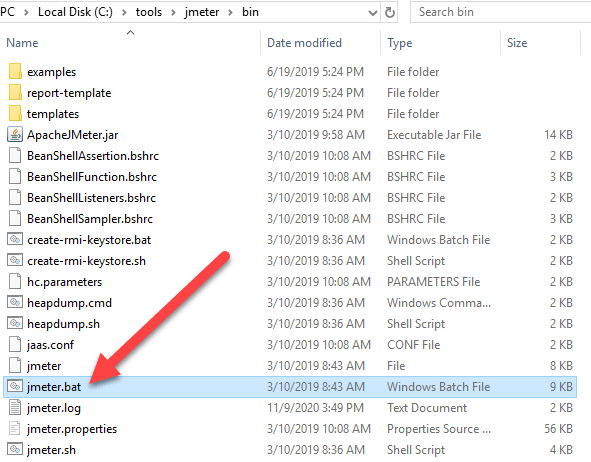
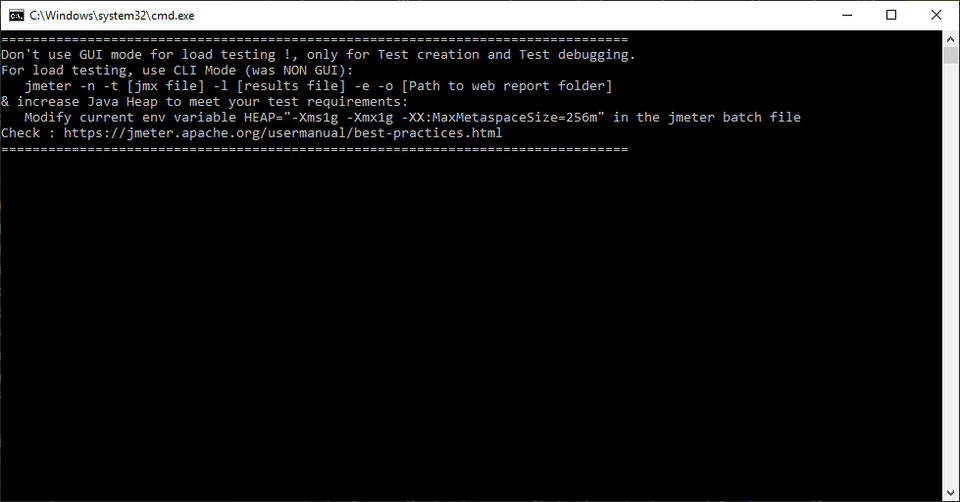
You'll notice that opening this file will first open a console window. Do not close that console window. Doing so will close the JMeter application, and you'll have to go back and open that jmeter.bat file again.
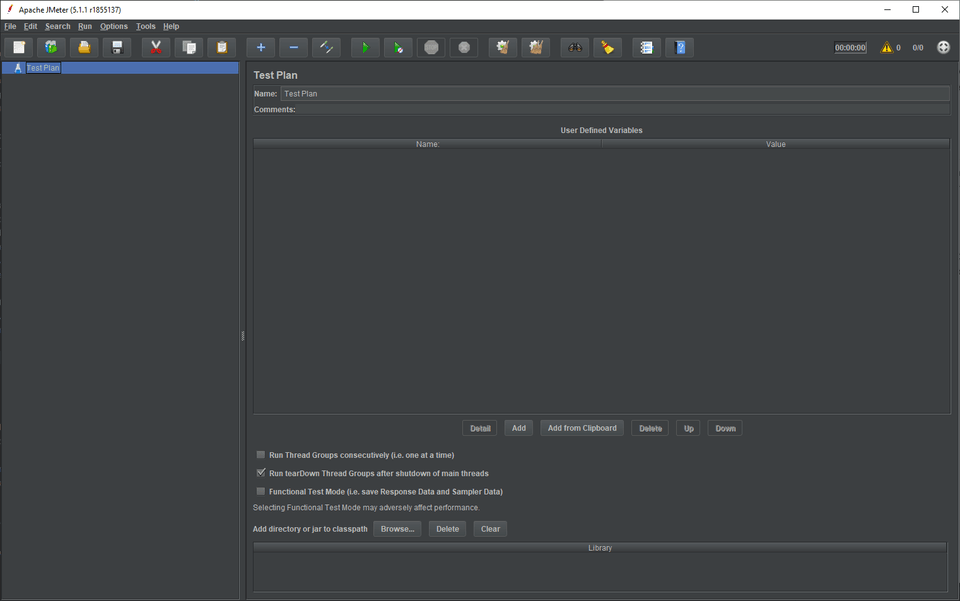
After a moment, JMeter itself will open.
Creating a Test Plan
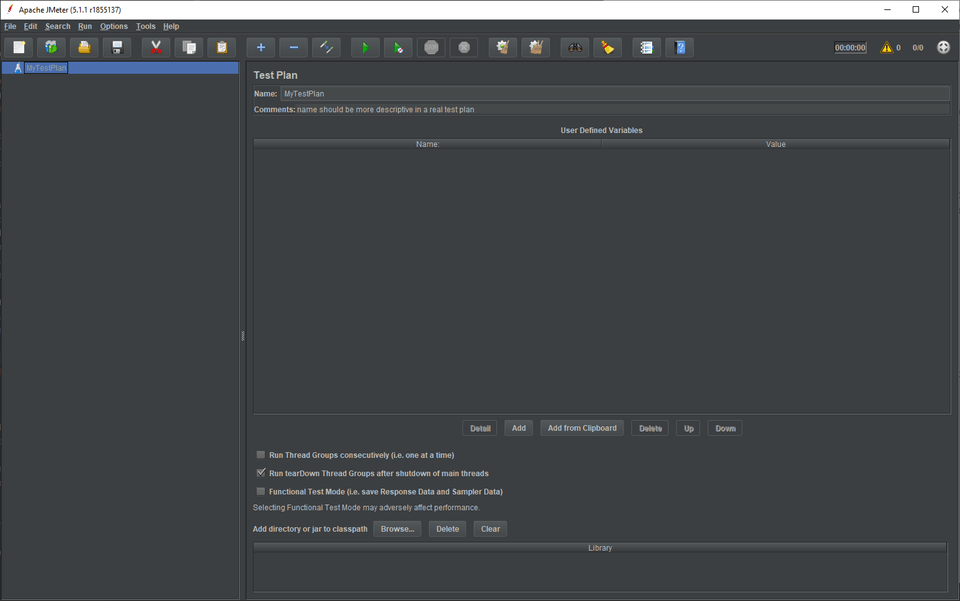
When you open JMeter, there will already be a test plan created for you. You can rename it, add comments, and adjust settings from that opening window.
Adding a Thread Group
To add a thread group (a group of simulated users), simply right click on your test plan and select Add -> Threads (Users) -> Thread Group.
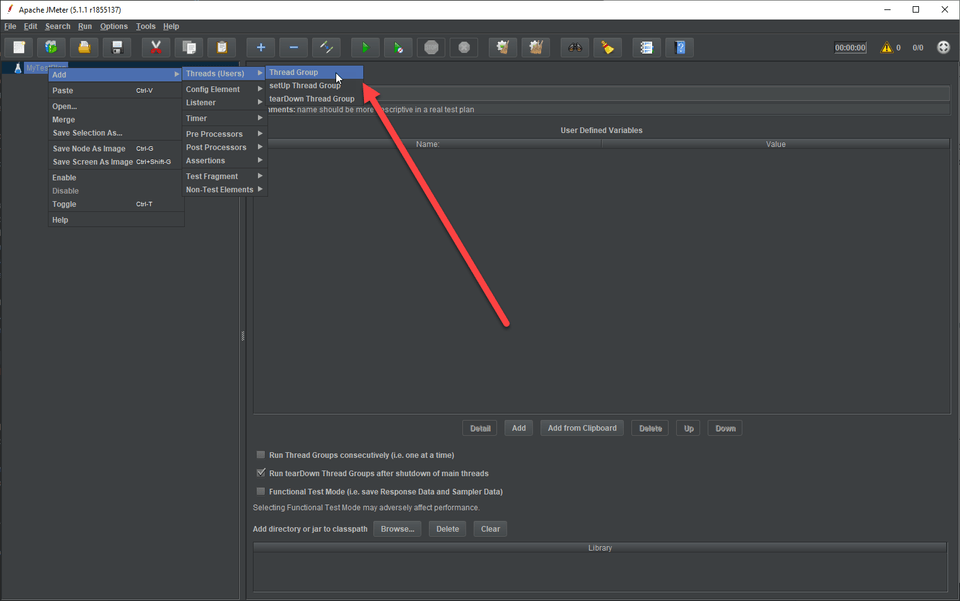
From there, you can rename the thread group and adjust settings.
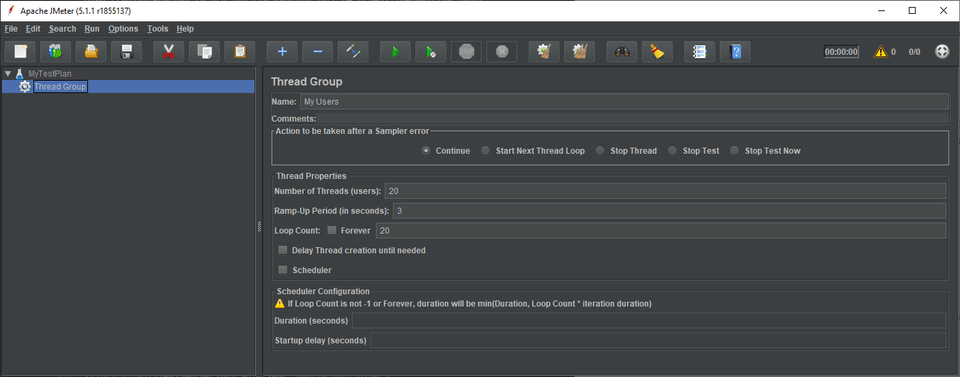
The most important settings here are the number of threads, ramp-up period, and loop count. The number of threads is the number of simulated users that will be hitting the application being tested. The ramp-up period is the amount of time from the test start for all the threads to start (the test will add threads linearly over that period of time until it reaches the specified number of threads). Finally, the loop count is the number of times the test will be executed per user.
Adding a Request
At this point, you'll need to have an idea of what you'll be testing. For this example, I'll test a blog post I wrote about HTML last month, but you can choose pretty much any website you like.
To add your request, right click on your thread group and select Add -> Sampler -> HTTP Request.
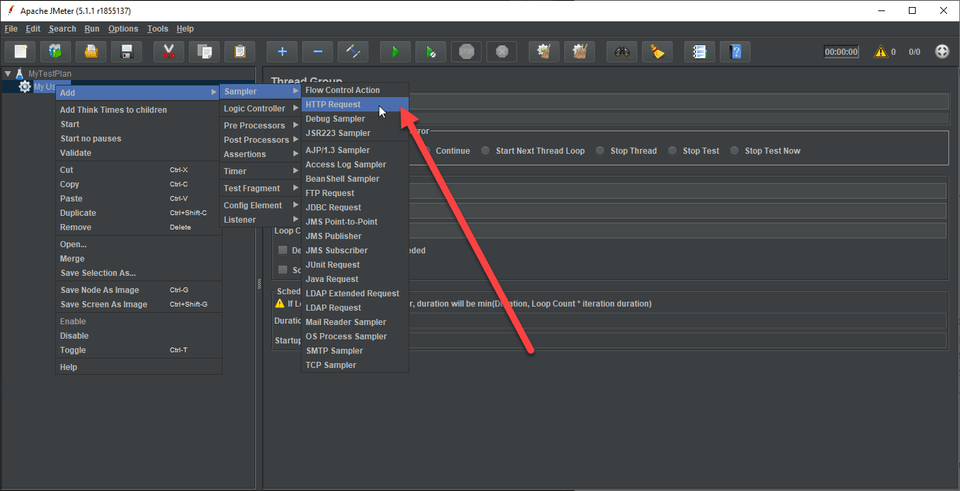
From here, of course, you can now edit your request, just as with your test plan and thread group.
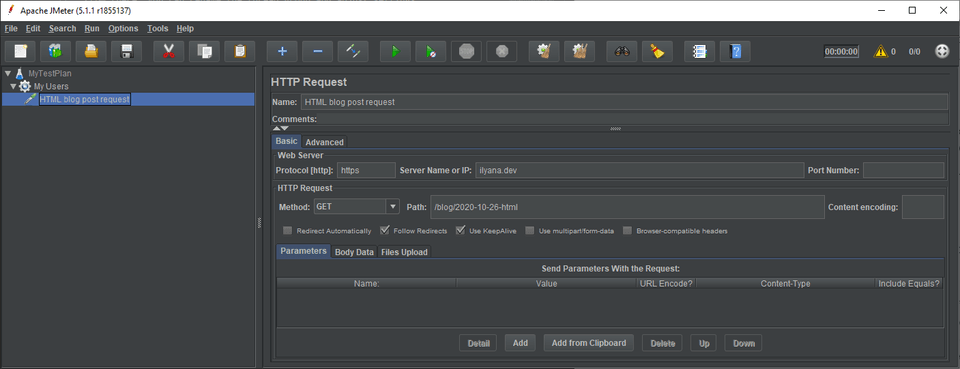
You'll notice that you can edit the name and add comments, as with each of the previous elements we added. Assuming the website you're testing uses the https protocol, rather than http (and most websites nowadays do use https), you'll need to enter https as the protocol. If the site you're testing uses http, you can leave it blank or enter http. You'll need to enter the root of the website in the "Server Name or IP" field. Finally, you should enter the path of the page you'd like to test. If you're trying to test the site's home page, you should just enter a "/" into the "Path" field.
Adding Listeners
Listeners are important because otherwise you wouldn't have anything storing the data from how the application reacts to the simulated users hitting it. JMeter supports a number of different types of listeners, so be sure to explore which ones best support your particular tests. For the purpose of this example, we'll add two simple ones.
Table
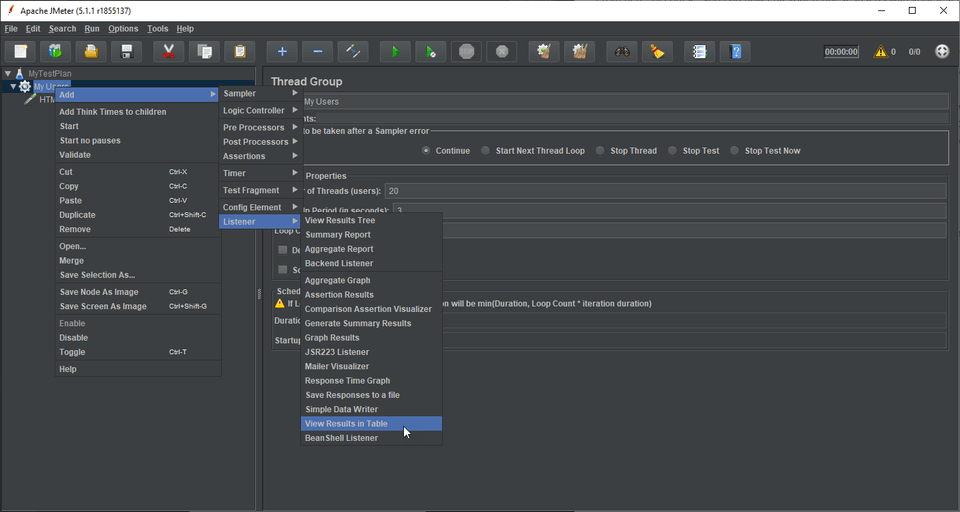
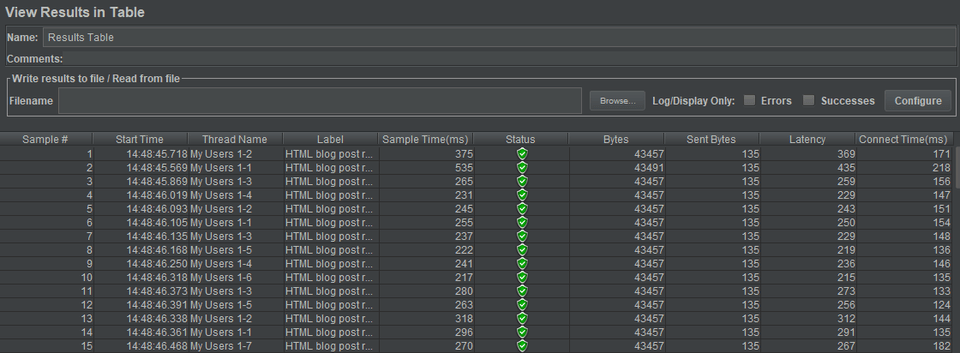
A table will give you various raw data from your tests, including sample time and latency. To add a table, you should right click on your thread group, then select Add -> Listener -> View Results in Table.
Once you start your test (see below), you should see results starting to come in, and you'll be able to view them in, you guessed it, a table:
Response Time Graph
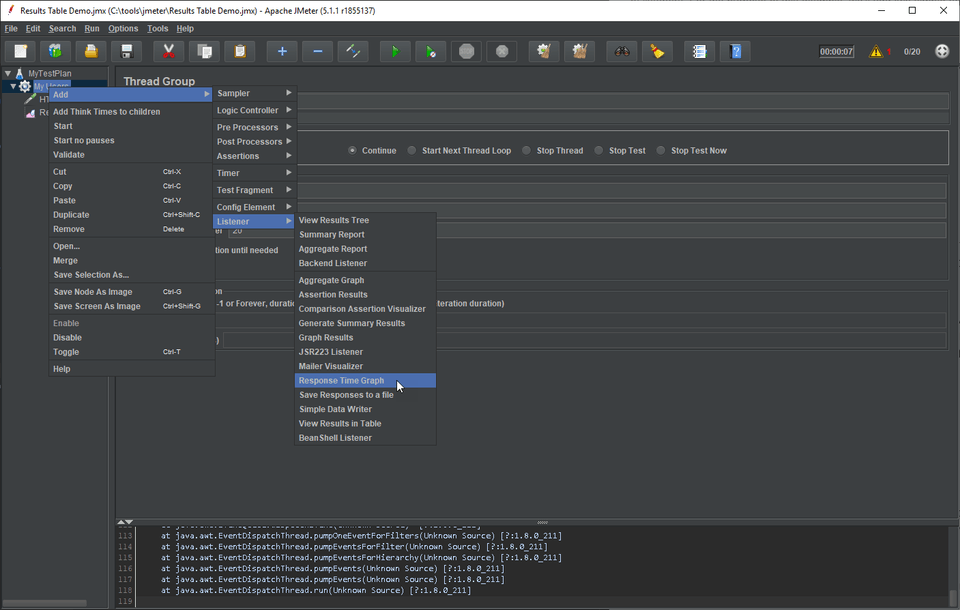
An even more useful listener, arguably (at least for visualization purposes), is the response time graph. To add this, you'll right click on your thread group and select Add -> Listener -> Response Time Graph.
You'll notice that there's a lot more to this graph window than there was in the table window. There are a lot of settings you can play with. Personally, I set the interval to 100 ms and otherwise just left the defaults, and that worked fine for me.
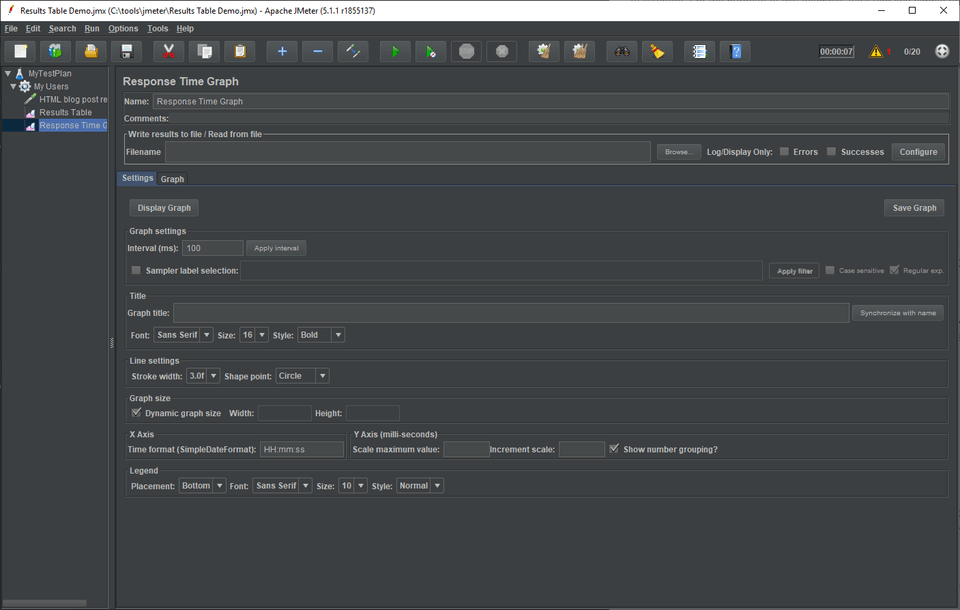
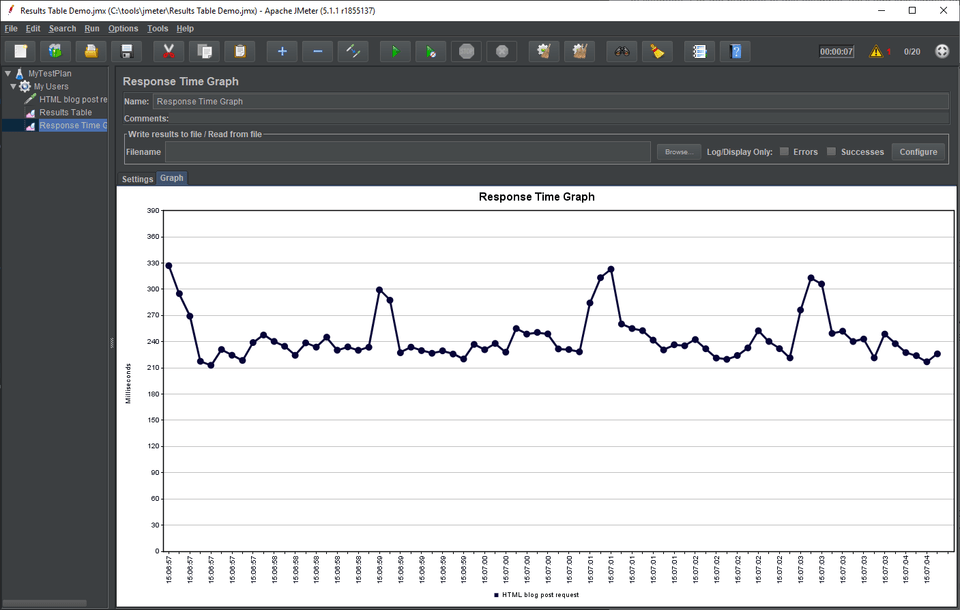
Once you start your test, you'll be able to see your results appear in a graph in this window:
Starting the test
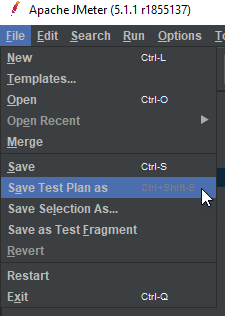
Before starting your test, you should save it. Use Ctrl + S to save or Ctrl + Shift + S to save as. You can also use the dropdown menu File -> Save or File -> Save Test Plan As.
Note that it's a good idea, for a "real" test, to save some of your results. You can do this by browsing for and selecting a location from each of your listeners (whichever ones you'd like to save data from).

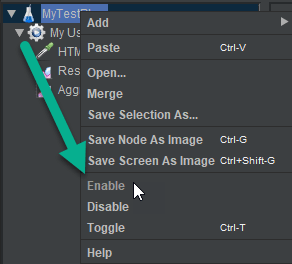
Now, it is very important that you enable your Test Plan before trying to run it. If you don't, you'll be sitting there wondering why you're just getting warnings when you try to run your test. To enable your test plan, right click on it and click Enable. Thanks to this Stack Overflow thread for this important instruction.
The easiest way to start your test is just to click the big green play button at the top of the screen or use the keyboard shortcut Ctrl + R.

Now you'll see data coming in to your listeners as described above.
One other important piece - if you want to clear the data your listeners have gathered, for whatever reason, you can use the broomstick icon to clear that data. The single broomstick will clear just the listener you currently have open, while the group of broomsticks will clear all. Don't confuse this with the Reset Search button, which also looks like a broomstick!

Advanced Tests
JMeter is a very robust tool with a lot of functionality, so of course the simple test we created above only begins to scratch the surface of what JMeter can do.
More complex tests can be added manually, but it is much easier to add them via a recording. You can use Firefox in conjunction with JMeter's own recording functionality, or use a Chrome plugin like BlazeMeter to record JMeter tests and them import those into JMeter.
Additional Performance Testing Information
Now you know how to gather data from performance tests of a given website. That's fantastic, but that data won't do you much good unless you have some idea of what it means. That's outside the scope of this article, but here are some resources you may find useful:
- My blog post on performance testing
- A very informative Pluralsight course on performance and scalability testing
- This blog post by Steve Smith on the Requests per Second Curve
Resources
- Great Tutorial Video on simple JMeter tests
- Great Tutorial Video on JMeter login tests using BlazeMeter
- JMeter Download
- Description of JMeter from Apache
- JMeter: Getting Started by Esteban Herrera on Pluralsight
- Another useful tool for performance testing is Microsoft Visual Studio. However, only the Enterprise edition of the software comes with this capability, and that is of course more expensive than the open source JMeter. I am not personally familiar with performance testing in Visual Studio, but if you want more information on performance testing in Visual Studio, this section of the docs is pretty informative.
Thanks for reading! I hope you find this and other articles here at ilyanaDev helpful! Be sure to follow me on Twitter @ilyanaDev.